
Machine Monitoring
 Visibility into machine utilization
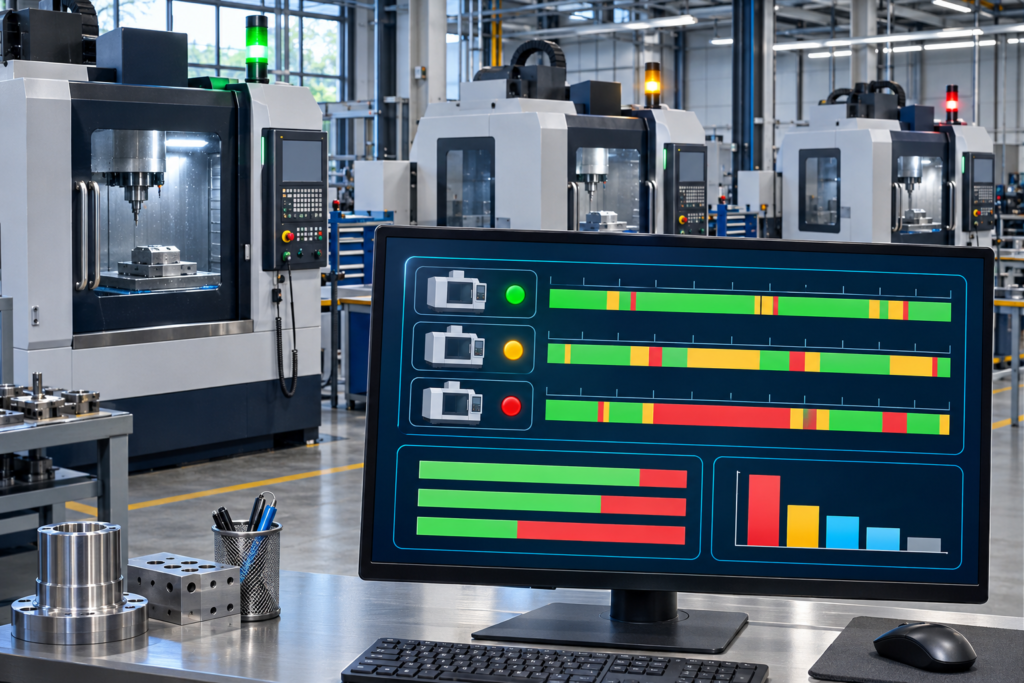
The solution automatically collects machine states and turns them into structured records of running time and downtime. Operational reasons and comments help production, maintenance and management teams understand what is happening on the shop floor and why time is being lost. The solution provides shared, verifiable records of machine utilization. Teams can prioritize interventions based on time lost, track the effects of measures implemented and support decisions on organizing activities and using production capacity.
Consistent classification of running time and downtime
Separate running time from scheduled downtime, delays, repairs and out-of-cycle time. Reasons, categories and display colors can be managed so that the same classification is used in monitoring and reports. The microstop consolidation rule classifies the intervals between two in-cycle events as running time when the combined duration of the intermediate states is less than three minutes.
Operator explanations complement automatic data
The operator sees the current machine state and responds to requests for explanations in an event list. Default reasons reduce repetitive intervention, while explicit requests apply to states and durations that require clarification. For states configured to request comments, exceeding the general threshold of N seconds allows an explanation to be entered while the event is in progress. When the state ends, an explanation is mandatory. Mandatory comment configuration is also associated with a request for a reason. Recorded reasons help distinguish waiting for material, tool preparation and other causes of downtime.
Charts for machines and production groups
The monitoring interface displays the current state and charts that link changes in utilization to the reasons for downtime. Information is available at machine level to track activity during the shift and quickly identify deviations. The hourly utilization chart highlights variations in running time, while the cumulative reasons chart shows the causes that consumed time during the shift. Viewing them together allows periods of low utilization to be investigated using the recorded data. Machines are organized into groups for analysis and reporting. A machine can belong to one or more groups, allowing different views of the same equipment fleet.
Configurable calendars, shifts and alerts
Define weekly calendars and shifts for each machine so that reports retain the production schedule context. When a machine remains in a configured state beyond the defined duration threshold, an email notification is triggered to the configured address. Production managers can identify stoppages requiring attention.
Reports for investigating lost production time
OPCAnalyser allows users to select the period and machines to analyze, review reasons and view history. State and totals reports are available for one machine, all machines or a selected group. The totals report details the number of occurrences, cumulative duration, share within the state category and share of total time. These indicators allow both event frequency and its impact on the analyzed interval to be assessed. The comparative view highlights differences between machines. Machines with a high proportion of delays, repairs or out-of-cycle time can be selected for detailed cause analysis.
Excel analysis and automatically distributed reports
Aggregated data is also available for analysis in Excel, identifying the machine, reason, state, duration and number of occurrences. Subsequent analyses can use the same categories as operational reports. The 12-hour utilization report shows hourly running trends and uses color highlighting for quick interpretation of results. Automatic execution is configured at intervals of N minutes for a predefined list of machines so that information is updated periodically for the production team. Reports are generated on a schedule and emailed to the configured address or distribution list. Managers therefore receive the same view of the analyzed period without manually rerunning each report.
Decisions based on data and production context
Utilization expresses the proportion of running time within the report's reference interval. Durations, frequencies and shares by reason show where time is spent and support comparisons between periods or machine groups. Interpretation of the results takes calendars, classification rules and intervals without readings into account. Intervals without monitoring data are identified separately. The solution provides shared, verifiable records of machine utilization. Teams can prioritize interventions based on time lost, track the effects of measures implemented and support decisions on organizing activities and using production capacity. Equipment compatibility and available signals are verified during implementation.